Table of Contents
Exercise 10 - Dragging images to obtain a similarity space
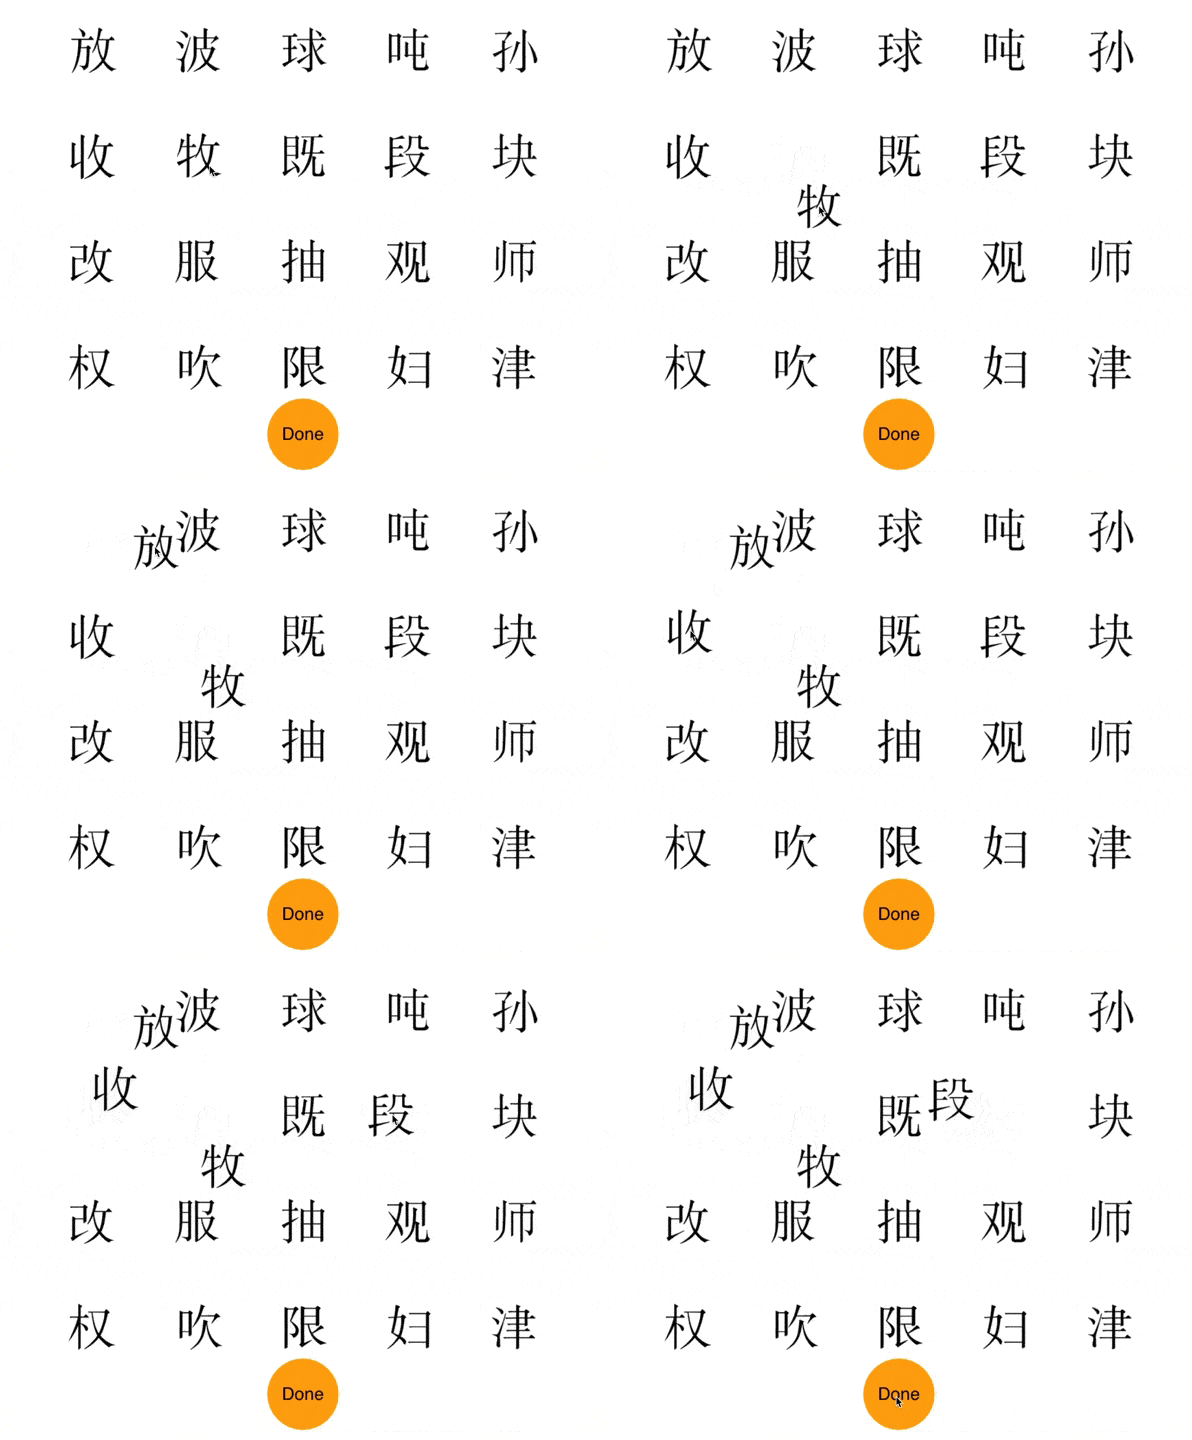
Suppose we want to find out how similar Chinese characters appear to people who do not read Chinese. There are several ways of doing this. One is to have people view pairs of images and provide pairwise similarity ratings. But the number of such judgments quickly grows with the number of stimuli. An alternative is to display many images at the same time and have people drag them into groups depending on how similar they look. So something like this:

Implementing this task in PsychoPy is very easy. Let's take 10 minutes to do this starting with the code below.
import random
from psychopy import visual, core, event
from useful_functions import loadFiles, calculateRectangularCoordinates

win = visual.Window([900, 850], color="white", allowGUI=False, units='pix')
pics = loadFiles('stimuli', 'png', 'image', win)
numPics = len(pics.keys())
positions = calculateRectangularCoordinates(150, 150, numPics / 4, numPics / 5)
random.shuffle(positions)
mouse = event.Mouse(win=win)

done = visual.Circle(win,lineColor="orange",fillColor="orange",size=100,autoDraw=True)
doneText = visual.TextStim(win,text="Done",color="black",height=25)
doneText.setAutoDraw(True)
done.setPos((0,-320))
doneText.setPos((0,-320))


#keep going

#draw all the stims in their initial positions

#now allow user to move the stimuli and end by clicking on the orange button
To calculate a similarity space from the resulting positions, you can use multidimensional scaling as implemented in scikit/sklearn libraries which should already be installed on your machine. The first step would be to take the Euclidean distances between the final positions of the pictures, and save them to a matrix that looks like this (showing the rows/columns for the first 10 images)
CC001      0     30    106    753    127    415    154    584    292    473
CC002     30      0    497    104    341    382    127    507     16    340
CC003    106    497      0    212    393    747    233    340    683    398
CC004    753    104    212      0    640    778    611    152    101    628
CC005    127    341    393    640      0     78    309    273    389    322
CC006    415    382    747    778     78      0    451    581    356    469
CC007    154    127    233    611    309    451      0    629    206    644
CC008    584    507    340    152    273    581    629      0    631    233
CC009    292     16    683    101    389    356    206    631      0    162
CC010    473    340    398    628    322    469    644    233    162      0
import csv
import numpy as np
import matplotlib.pyplot as plt
from sklearn import manifold
data = list(csv.reader(open("distances.csv", "r"), delimiter='\t'))
dists = [map(float,distance[1:-1]) for distance in data
adist = np.array(dists)
amax = np.amax(adist)
adist /= amax
mds = manifold.MDS(n_components=2, dissimilarity="euclidean", random_state=6)
results = mds.fit(adist)
#this is your embedding
coords = results.embedding_
#here's some plotting code (though I would ordinarily do this in R)
plt.subplots_adjust(bottom = 0.1)
plt.scatter(coords[:, 0], coords[:, 1], marker = 'o')
for label, x, y in zip(characters, coords[:, 0], coords[:, 1]):
plt.annotate(
label,
xy = (x, y), xytext = (-20, 20),
textcoords = 'offset points', ha = 'right', va = 'bottom',
bbox = dict(boxstyle = 'round,pad=0.5', fc = 'yellow', alpha = 0.5),
arrowprops = dict(arrowstyle = '->', connectionstyle = 'arc3,rad=0'))
plt.show()